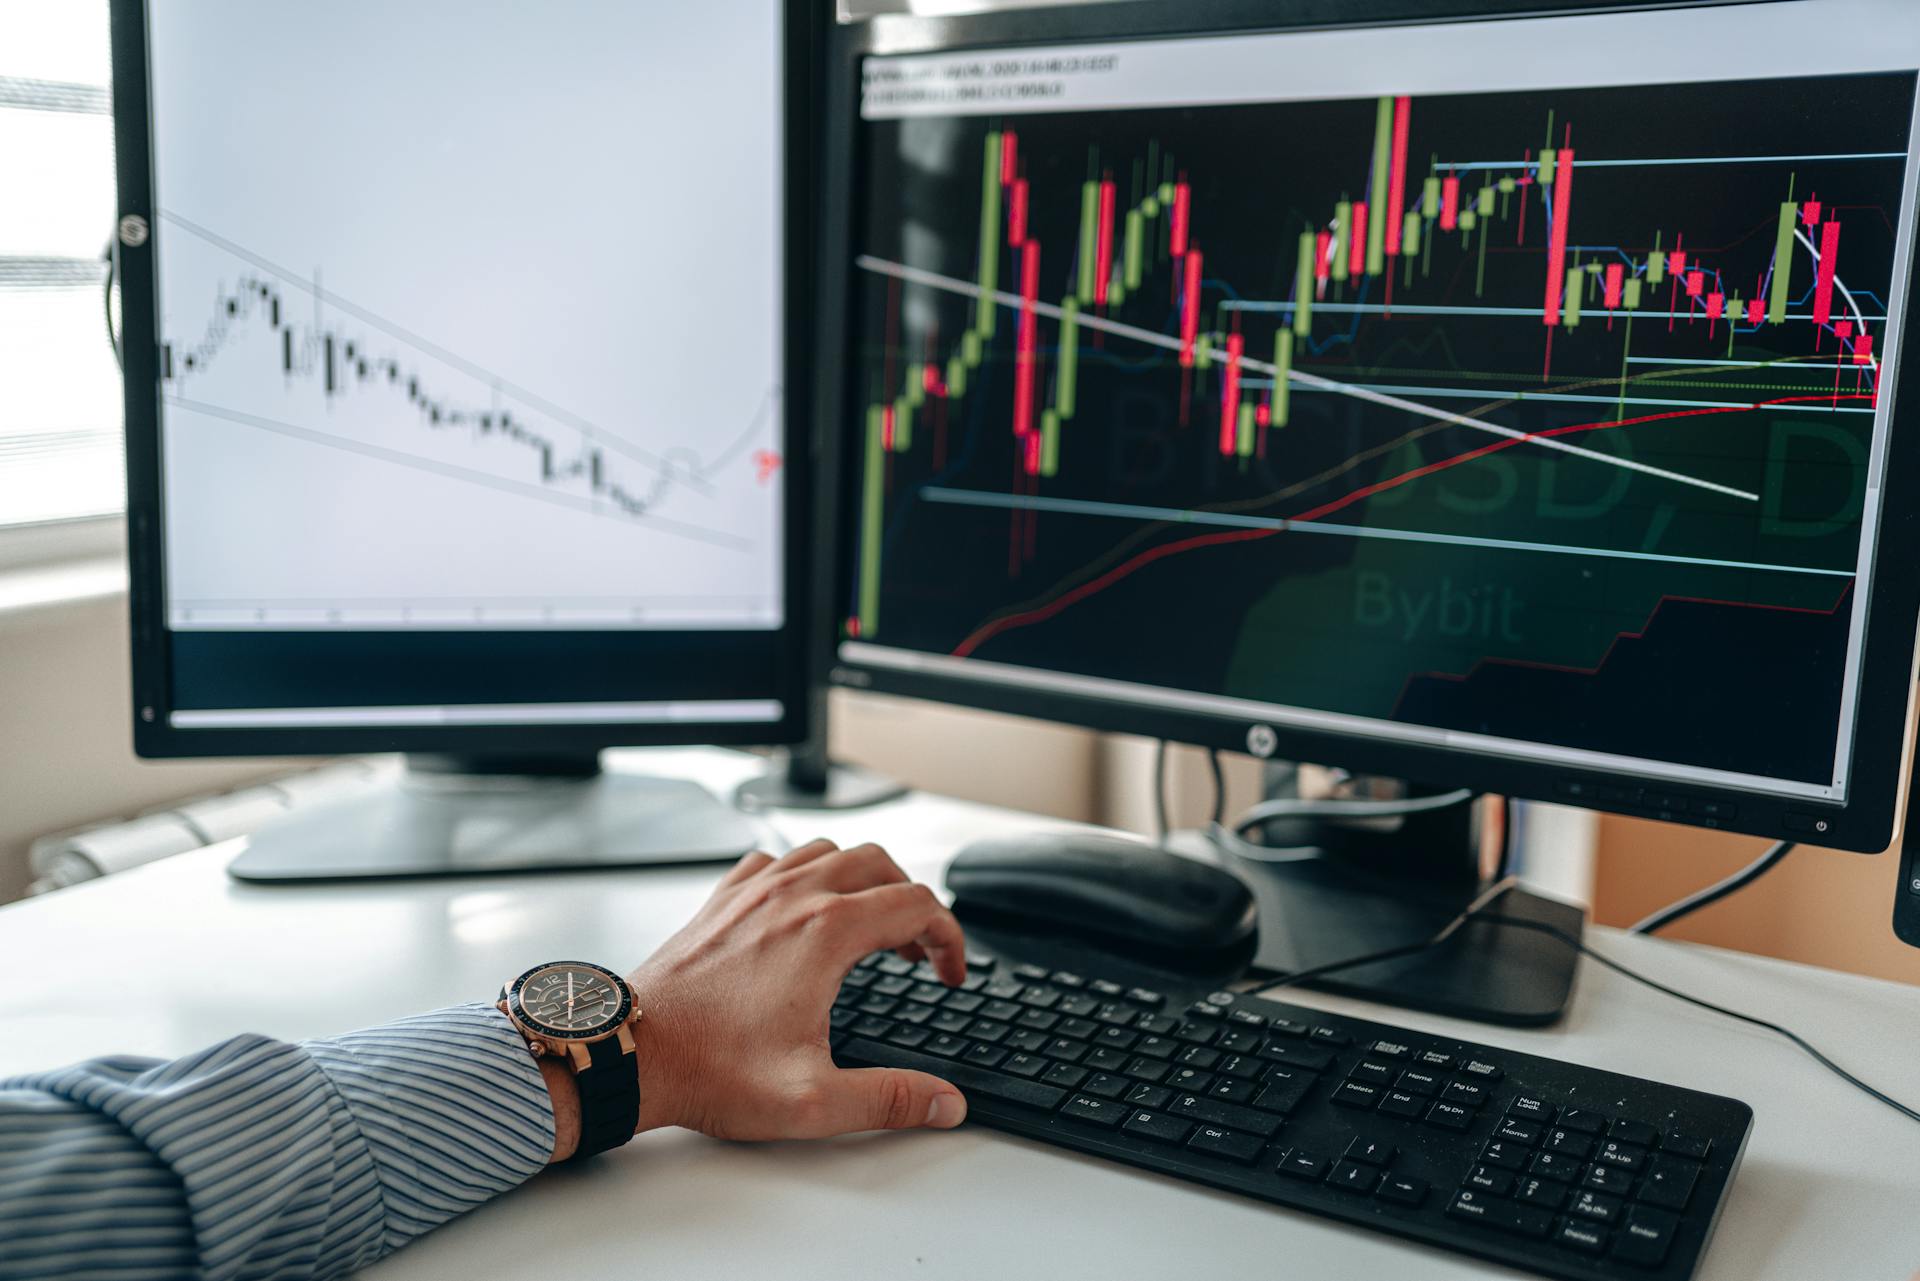
The thinkorswim platform offers a range of volume indicators that can help traders make more informed decisions.
The Accumulation/Distribution Line indicator is a momentum indicator that measures buying and selling pressure by tracking the relationship between price and volume.
By analyzing the AD Line, traders can identify areas of accumulation and distribution, which can be valuable in making trading decisions.
The On Balance Volume (OBV) indicator is a cumulative total of the volume traded on days when the stock closes higher and subtracts the volume traded on days when the stock closes lower.
This indicator can be used to confirm trends and identify potential reversals.
The Volume Profile indicator displays the volume traded at different price levels, providing a visual representation of market activity.
By examining the Volume Profile, traders can identify areas of high and low volume, which can be useful in identifying potential trading opportunities.
Consider reading: Thinkorswim Profile
ThinkScript Tutorial Overview
This thinkScript tutorial is a great resource for traders looking to analyze market activity and identify entry and exit points. The indicator quickly reveals changes in volume strength.

By comparing volume across multiple stocks, you can identify momentum shifts and potential reversals.
The tutorial is useful because it shows how to layer on logic for the first symbol and then use a tool like ChatGPT to clone the code for the remaining process. This can save time and make the process more efficient.
The free version of ChatGPT is used to help build this ThinkOrSwim indicator, making it a valuable tool for traders.
Calculating Volume
Calculating Volume is a crucial step in analyzing stock performance. The intensity variable, intensity1, provides the ratio between today's volume and the average, making it easy to spot spikes or drops.
To calculate the volume data, you'll need to fetch the current volume for a stock, like Apple (AAPL), and calculate its average over the last 20 periods.
The average volume is calculated using the volAvg1 function, which takes into account the last 20 periods of trading data.
By comparing today's volume to the average, you can quickly identify significant changes in trading activity.
Expand your knowledge: Stock Information for Thinkorswim
Customizing the Indicator
Customizing the indicator is where the magic happens. You can fine-tune the indicator to suit your trading strategy by adjusting the length value for a more responsive or smoother volume average.
To make the color shifts more aggressive or subdued, you can modify the AssignValueColor thresholds. This will give you more control over how the indicator responds to changes in volume.
You can also swap out the current symbols to track different stocks, making the indicator even more versatile.
Adding Bubbles for Symbol Identification
Adding Bubbles for Symbol Identification is a game-changer for keeping track of multiple stocks. It's a simple yet effective way to identify which row corresponds to which symbol.
To add chart bubbles for symbol identification, you can follow the steps outlined in the article. This feature is particularly useful when tracking multiple stocks, as it provides an additional visual cue for easy reference.
One key benefit of chart bubbles is that they appear only on the last valid bar, making it easy to identify the symbol without cluttering the chart. The color of the bubble also matches the intensity color coding, which can be a helpful visual aid.
Here's an interesting read: Volume in Trading Stocks

Here are the steps to add chart bubbles for symbol identification:
- Add chart bubbles labeled with the symbol's ticker.
- The bubble appears only on the last valid bar.
- The color matches the intensity color coding.
By adding chart bubbles, you can easily keep track of which row corresponds to which symbol, making it easier to customize the indicator to your needs.
Customizing the Indicator
Customizing the indicator is where the magic happens. You can fine-tune it to suit your trading strategy by adjusting a few key parameters.
The length value can be changed to make the volume average more responsive or smoother. This is a simple tweak that can make a big difference in how the indicator behaves.
Color Thresholds can be modified to make the color shifts more aggressive or subdued. This is a great way to customize the visual representation of the indicator to your liking.
You can swap out the current symbols to track different stocks. This is a great way to keep an eye on multiple markets at once.
Here are some specific options to consider:
- Length: 9, 14, or 20
- Color Thresholds: High, Medium, or Low
- Symbols: AAPL, GOOGL, or MSFT
Behavior Features
The Volume Behavior for ThinkorSwim is a powerful tool that helps you confirm price direction and make informed trading decisions.
The indicator displays four types of candles: Green, Grey, Red, and Cyan. Each candle represents a specific volume behavior, helping you identify trends and potential reversals.
A Green Candle signifies a volume UP trend, indicating more trading volume than the previous candle. This is an accumulation candle, showing the trend is picking up speed.
Here are the four candle colors and their meanings:
The Volume Behavior for ThinkorSwim also helps you identify potential reversals, such as a Grey Candle after a Green Candle, indicating the upside is running out.
Average Stats Indicator
The Average Stats Indicator is a must-have for any thinkorswim user who wants to make informed trading decisions. This indicator shows you not only today's volume but also how it compares to the average volume over two different time frames of your choosing.
You can customize these periods to suit your trading strategy, making this indicator both flexible and powerful. It's perfect for traders who like to use volume in their trading.
The Average Stats Indicator is built using thinkScript coding, and it's surprisingly easy to create. With a few simple steps, you can have this indicator up and running in no time.
In this tutorial, we'll be creating labels to display the current volume and averages in a readable format. This will make it easy to see at a glance how the current volume compares to the average volume.
Fetching Data
Fetching Data is a crucial step in creating thinkorswim volume indicators. This involves bringing in the necessary data to analyze and visualize.
You can capture the total daily volume, regardless of which time frame you have on your chart, by fetching the daily volume data. This code is essential for understanding market trends and movements.
Thinkorswim's system allows you to easily fetch the data you need, making it a convenient platform for traders and analysts.
Input Parameters and Options
The input parameters and options for thinkorswim volume indicators are where the magic happens. You get to customize the settings to fit your trading style and preferences.
The "price per row height mode" input defines the height setting mode for each row of the histogram, with options for "AUTOMATIC", "TICKSIZE", and "CUSTOM" modes.
You can set the height of each row manually when using the "CUSTOM" mode by defining the "custom row height" input. This allows you to tailor the height to your specific needs.
The "time per profile" input defines the time interval to compile the volume data for the histogram, with options for "CHART" and various manual settings like "BAR", "MINUTE", "HOUR", "DAY", "WEEK", "MONTH", and "OPT EXP".
To calculate the Volume Profile, you can define the number of periods using the "multiplier" input, but note that this setting is ignored if the "time per profile" input is set to "CHART".
A fresh viewpoint: Thinkorswim Macd
You can also customize the display of the profile on the expansion area of the chart by setting the "on expansion" input to "Yes" or "No".
The "profiles" input defines the number of profiles to be displayed if "on expansion" is set to "No", but this setting is ignored if "on expansion" is set to "Yes".
You can highlight the histogram row containing the POC price level by setting the "show point of control" input to "Yes", and highlight the Value Area by setting the "show value area" input to "Yes".
The "value area percent" input defines the percentage of the trading activity for which the Value Area is determined, and the "opacity" input defines the degree of histogram opacity, in percent.
Here's a summary of the input parameters and options:
Frequently Asked Questions
Does Thinkorswim have volume profiles?
Yes, Thinkorswim offers Volume Profile charts that display trading activity and dominant price values over a specified time period. This tool helps traders visualize price distribution and make informed decisions.
Sources
- https://tosindicators.com/indicators/volume-intensity
- https://globaltradingsoftware.com/product/volume-behavior-for-thinkorswim/
- https://usethinkscript.com/threads/favorite-volume-indicators-in-thinkorswim.15694/
- https://tosindicators.com/indicators/average-volume
- https://toslc.thinkorswim.com/center/reference/Tech-Indicators/studies-library/V-Z/VolumeProfile
Featured Images: pexels.com