
Timing the market can be a costly endeavor, and the numbers don't lie. A study found that 70% of investors who try to time the market end up with lower returns than the market average.
Trying to pick the exact top or bottom of the market is a daunting task, and the statistics show it. In a recent analysis, it was found that only 3% of investors who attempted to time the market successfully beat the market average over a 10-year period.
Investors who try to time the market often end up missing out on gains. For example, a study found that investors who missed the top 5 days of the S&P 500's performance over a 10-year period would have lost out on an average of 1.5% of returns.
For another approach, see: Top Hedgefunds
Understanding Market Timing
Market timing is a strategy that involves making investment decisions based on predictive methods. It's a key component of actively managed investment strategies, and many investors believe it's possible to time the market.

However, few investors have been able to predict market shifts with consistency, and even professionals who try to time the market usually fail. In fact, a report from S&P Dow Jones Indices showed that over a 20-year period, fewer than 10 percent of actively managed U.S. stock funds managed to beat the index.
Some investors use chart analysis, economic forecasts, and even gut feelings to decide when to buy and sell securities. But these methods are not foolproof, and even professional day traders, portfolio managers, and full-time investors have limited success with market timing.
A buy-and-hold approach, on the other hand, involves buying shares and holding them over the long-term, irrespective of market movements. Research shows that this passive approach produces better long-term results.
Here's a comparison of the results from a study by Charles Schwab:
- An investor with perfect market timing: $151,391
- An investor who immediately invested their money: $135,471
- An investor who performed dollar-cost averaging: $134,856
- An investor with bad market timing: $121,171
- An investor who left their money in cash: $44,438
As you can see, even an investor with perfect market timing didn't do significantly better than an investor who immediately invested their money. In fact, the investor who immediately invested their money came in second-best. This highlights the difficulties of market timing and the importance of a buy-and-hold approach.
Investors who try to time the market often miss out on big rallies, which can significantly impact their long-term gains. A study by Betashares found that if you missed out on just a handful of the biggest rallies, your gains over the long term would be significantly lower.
Intriguing read: The Investment Gains from a Universal Life Policy
Market Timing Strategies

Market timing is a complex task that even market professionals agree is difficult to achieve for any substantial length of time. Many investors believe it's impossible to time the market, while active traders strongly believe in its potential.
Dollar-cost averaging is a strategy that can help investors avoid the risks associated with market timing. By investing periodically, rather than all at once, you can get exposure to a variety of market conditions and potentially produce better results overall.
Investing all your money immediately can be scary, but dollar-cost averaging can provide a sense of control over your portfolio. It's still better than trying to time the market in most cases, even if it may not always beat investing right away.
Take a look at this: How Do Angel Investors Make Money
Dollar-Cost Averaging
Dollar-cost averaging is a strategy that involves investing periodically, rather than all at once. This can help avoid the risk of investing a lump sum when the market is at its high point.
Investing all your money immediately can be scary, feeling like you're giving up control of your portfolio. Not all investors are comfortable with that.
The idea behind dollar-cost averaging is to get exposure to a variety of market conditions, which can produce better results overall.
Diversified Portfolio
A diversified portfolio is key to managing risk in investing. By spreading your risk across multiple assets, you can protect yourself against market volatility.
Investing in several types of assets, such as stocks, bonds, and real estate, can give you exposure to different markets. This helps you avoid being concentrated in a single type of investment.
Having a diversified portfolio can lead to better results over the long-term. It's a smart way to reduce your risk and increase your chances of financial success.
For more insights, see: Diversified Etfs
Portfolio Rules for Valuation Aware Equity Portfolios
The Steady Equity investment strategy has outperformed market-timing in most market environments. This is a key takeaway from a study that measured performance over a 21-year period.
The only instance where the Valuation Aware strategy outperformed was between August 2020 and February 2022. This was likely due to the analysts' perception of the U.S. market as overvalued at the time.
The Steady Equity strategy's outperformance was mostly indifferent to when the study began. However, starting with a market that was overvalued did shrink the outperformance margin, by about 8% on average.
The original month's $833 investment in the Steady Equity strategy grew to $889,000 by the end of the study. This is a significant outperformance compared to the Valuation Aware approach, which grew to $809,000.
The difference in growth between the two strategies was substantial, with the Steady Equity strategy outperforming by $80,000.
Portfolio Cash Balance is Substantial Early On
A significant issue with the Valuation Aware strategy is that its cash balance is substantial early on, weighing on results.
This means that the portfolio is holding onto a lot of cash, which isn't being invested in the market.
In the study, the Valuation Aware portfolio's cash balance was particularly large early in the 21-year period, which affected its performance.
It's worth noting that this cash balance is a result of the strategy's approach to buying shares when they're undervalued and de-emphasizing them when overpriced.
However, as we'll discuss later, the stock market has a tendency to see annual returns higher than savings account interest rates, even when the market is slightly overvalued.
Expand your knowledge: Gold to Silver Ratio When to Buy
This makes it challenging for the Valuation Aware strategy to keep up with a steady equity portfolio that's able to strongly compound capital in nearly all market environments.
In fact, the study found that in the vast majority (79%) of months over the past 21 years, the market has been within 10% of fair value, making it difficult for the Valuation Aware strategy to make up lost ground.
Market Timing Risks
Timing the market is a challenging task, and research from JP Morgan shows that the best days in the US market often occur within two weeks of the worst days.
The close proximity of the best and worst days makes it difficult to buy shares at the bottom before they climb again.
According to JP Morgan's study, six of the seven best days occurred after the worst day over the last 20 years.
This means that it's unlikely to consistently miss the worst days while being invested in the market for the best days.
You might enjoy: Jp Morgan Active Etfs

In fact, even professionals who try to time the market usually fail, with fewer than 10 percent of actively managed U.S. stock funds managing to beat the index over a 20-year period.
A study by S&P Dow Jones Indices found that even with perfect market timing, an investor would still have lost money if they had to sell stocks or other securities at a loss because the price failed to increase.
Here's a comparison of different investment strategies over 20 years:
As you can see, the investor with perfect market timing did the best, but the second-best result was from the investor who immediately invested their money, paying no attention to market timing.
For your interest: How to Become a Private Investor
Market Timing Analysis
Over the past 21 years, the Nifty 50 index has hit a new high in 55 months, averaging once every 5 months.
This means that waiting for a correction before investing at all-time highs may not be as effective as you think. The stock markets have seen a new all-time high in each of the last 8 years except 2016, from 2013 onwards.
In fact, since 2000, there have been only 8 years when the stock markets did not reach a new all-time high.
Readers also liked: Vanguard High Dividend Yield Etf
U.S. Price/Fair Value Estimate Ratio Has Oscillated Over Time
The U.S. Price/Fair Value Estimate Ratio has oscillated over time, and it's a signal that holds some predictive power. This means it can help us anticipate market trends and make informed investment decisions.
The ratio is calculated by comparing the aggregate price of the market to the fair value estimate, and it's been evaluated over a 20-plus year time period. This extensive analysis has shown that the median return of the market is higher when the market is undervalued, and lower or even negative when viewed as overvalued.
In fact, when the aggregate price/fair value estimate ratio is less than 1.0, the market is considered undervalued, and the opposite is true when the ratio is greater than 1.0. This distinction is crucial for investors who want to make the most of their investments.
The data suggests that the market tends to see higher returns over longer periods, even when it's slightly overvalued. This is a key takeaway for investors who are considering a valuation-aware equity investing strategy.
You might like: Do Angel Investors Get Equity
Nifty 50 All-Time Highs (2000-2020)
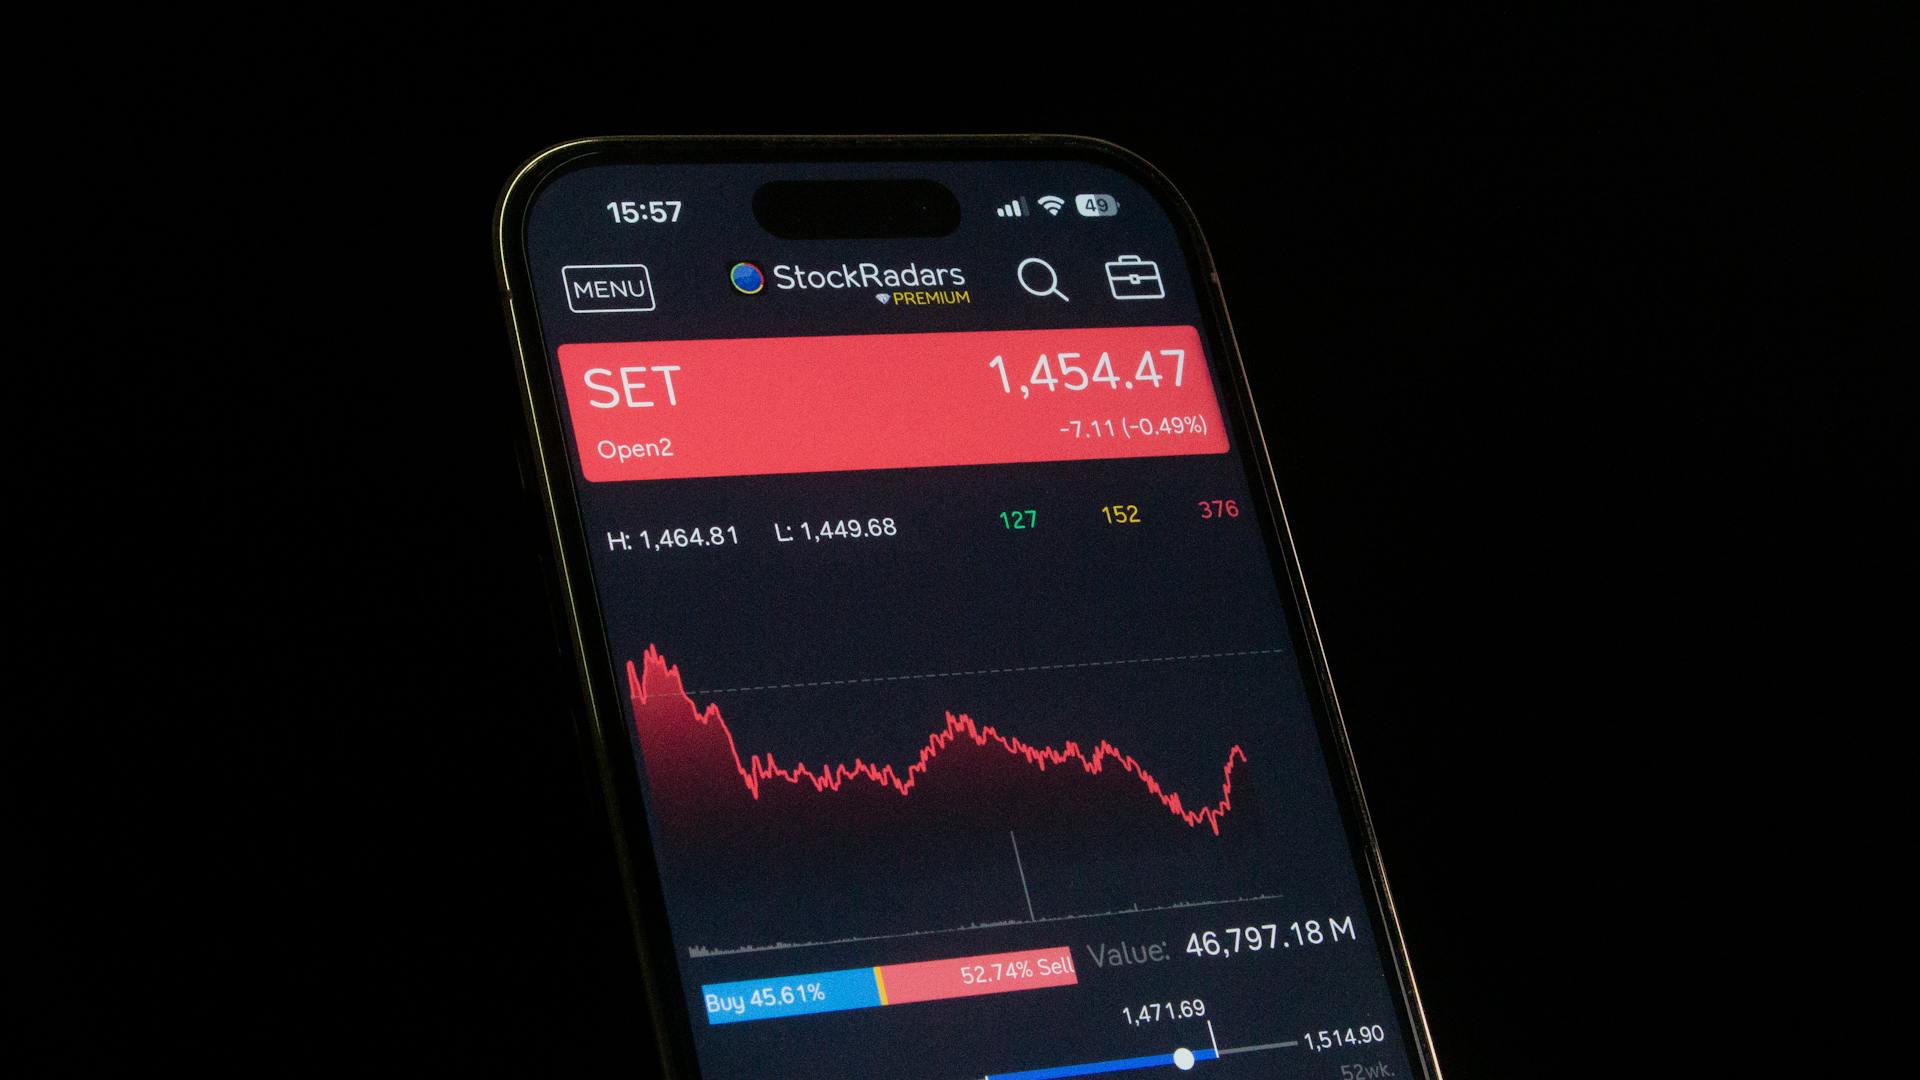
The Nifty 50 All-Time Highs (2000-2020) reveal a fascinating trend. In the last 21 years, the Nifty 50 index has hit a new high in 55 months.
This translates to a new high every 5 months on average. To put this into perspective, consider that there have been only 8 years when the stock markets did not reach a new all-time high.
Here's a breakdown of the Nifty 50 All-Time Highs for each year from 2000 to 2020:
These numbers demonstrate that the stock market has been hitting all-time highs quite frequently over the past two decades.
Market Timing Examples
Timing the market can be a costly endeavor, as seen in the example of the 2008 financial crisis. The S&P 500 plummeted by 38.5% in just one year.
Getting in and out of the market at the right time is nearly impossible, as the 1999-2000 dot-com bubble burst illustrates. The NASDAQ composite index lost 78.4% of its value in just over a year.
Trying to time the market can lead to missed opportunities, as the 2010-2011 correction shows. Investors who sold their stocks during this time period missed out on the subsequent 2-year bull run, which saw the S&P 500 gain 64.5%.
The 1970s bear market, which lasted for 61 months, is another example of the challenges of market timing. During this time, the S&P 500 declined by 45.1%.
In contrast, sticking to a long-term investment strategy can provide a smoother ride, as the 1980-1989 bull market demonstrates. The S&P 500 grew by 219.5% over this 10-year period.
Consider reading: Dollar Cost Averaging S&p 500
Criticism of
The cost of timing the market can be steep, and the facts are clear: even professionals struggle to get it right. An investor employing a market timing strategy must be correct 74% of the time to beat the benchmark portfolio of similar risk annually.
This is a daunting task, and the numbers don't lie. A 2017 study from the Center for Retirement Research at Boston College found that target-date funds that attempted market timing underperformed other funds by as much as 0.14 percentage points—a 3.8% difference over 30 years.

A study from Morningstar shows that actively managed funds have generally failed to survive and beat their benchmarks, especially over longer time horizons. In fact, only 23% of all active funds surpassed the average of their passive rivals over the 10-year period ended June 2019.
Here are some key statistics on the success rates of actively managed funds:
The numbers are clear: market timing is a tough strategy to execute, and the risks are high. Even professionals who try to time the market usually fail, with fewer than 10 percent of actively managed U.S. stock funds managing to beat the index over a 20-year period.
Sources
- https://www.investopedia.com/terms/m/markettiming.asp
- https://www.etmoney.com/learn/stocks/timing-the-market-vs-time-in-the-market-whats-the-better-approach/
- https://www.bankrate.com/investing/timing-the-stock-market/
- https://www.morningstar.com/portfolios/staying-invested-beats-timing-marketheres-proof
- https://www.betashares.com.au/insights/why-timing-the-market-is-a-fools-errand/
Featured Images: pexels.com


