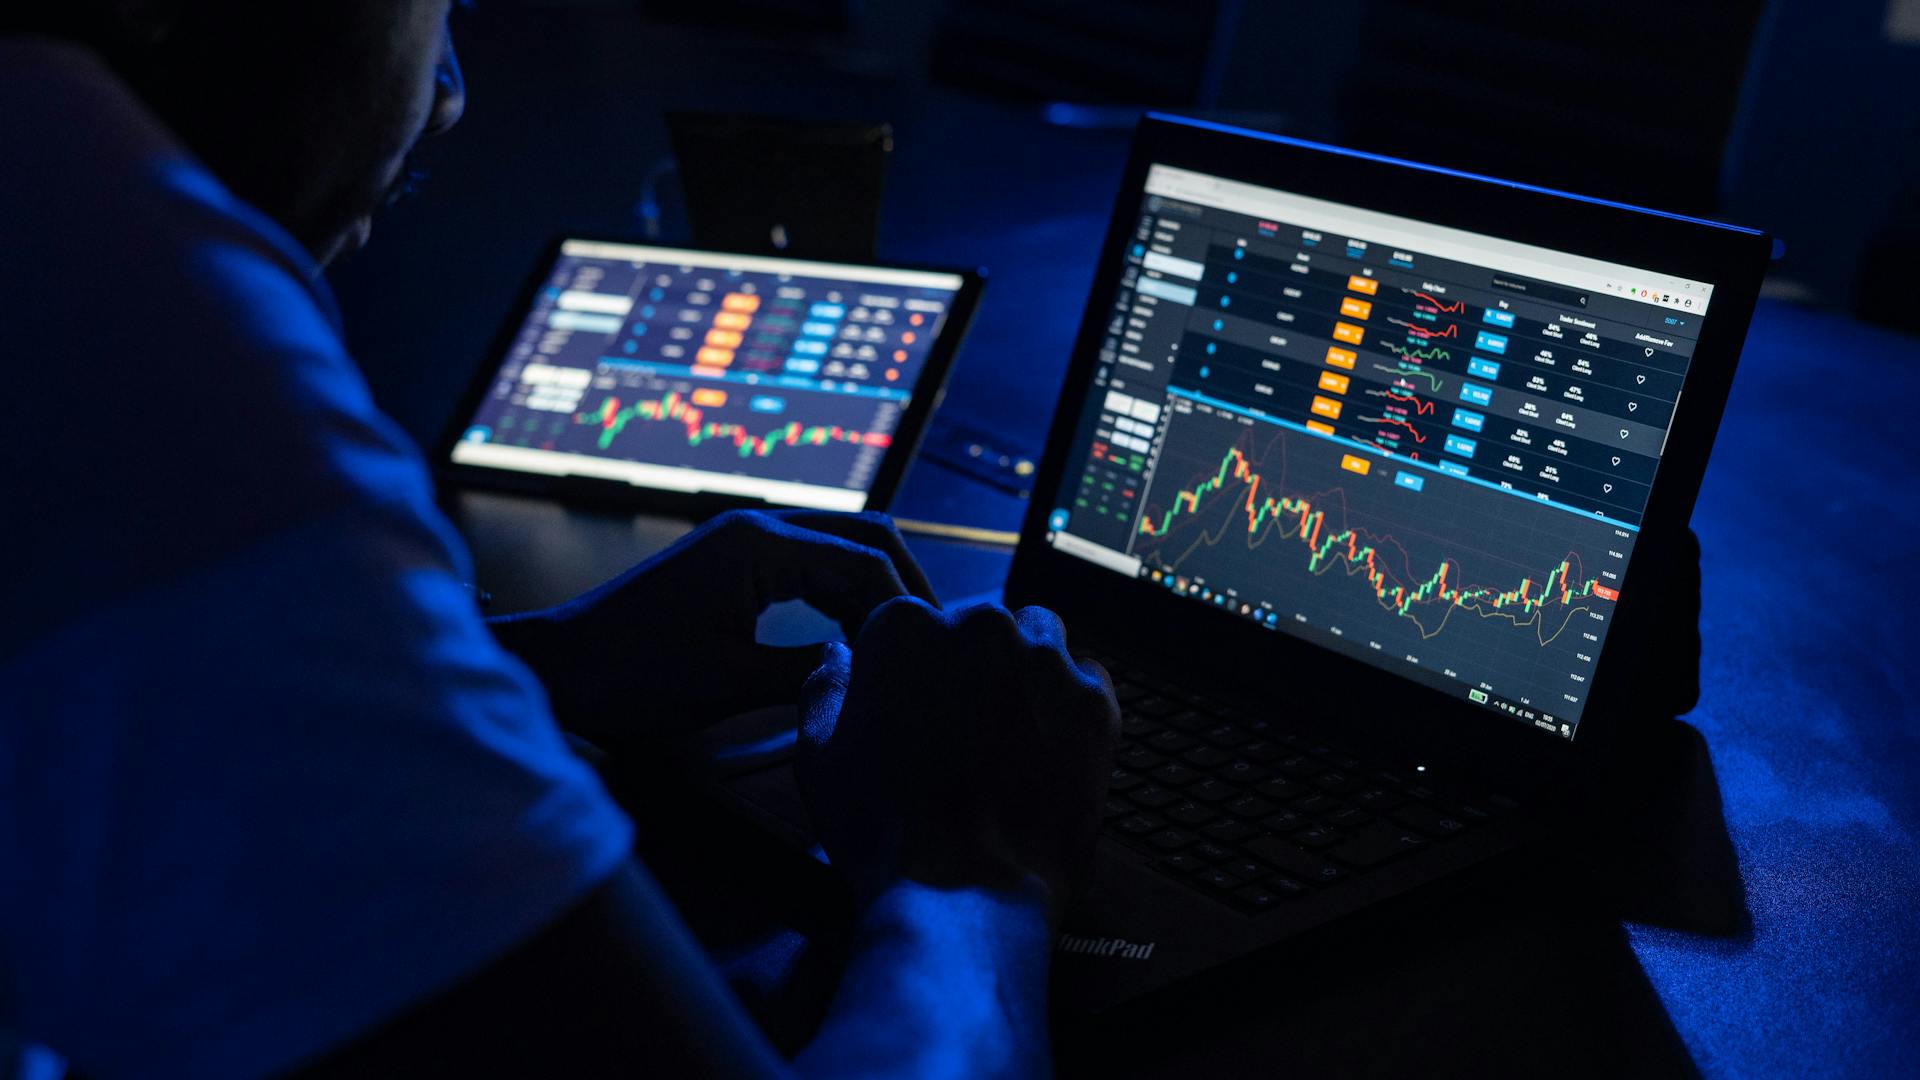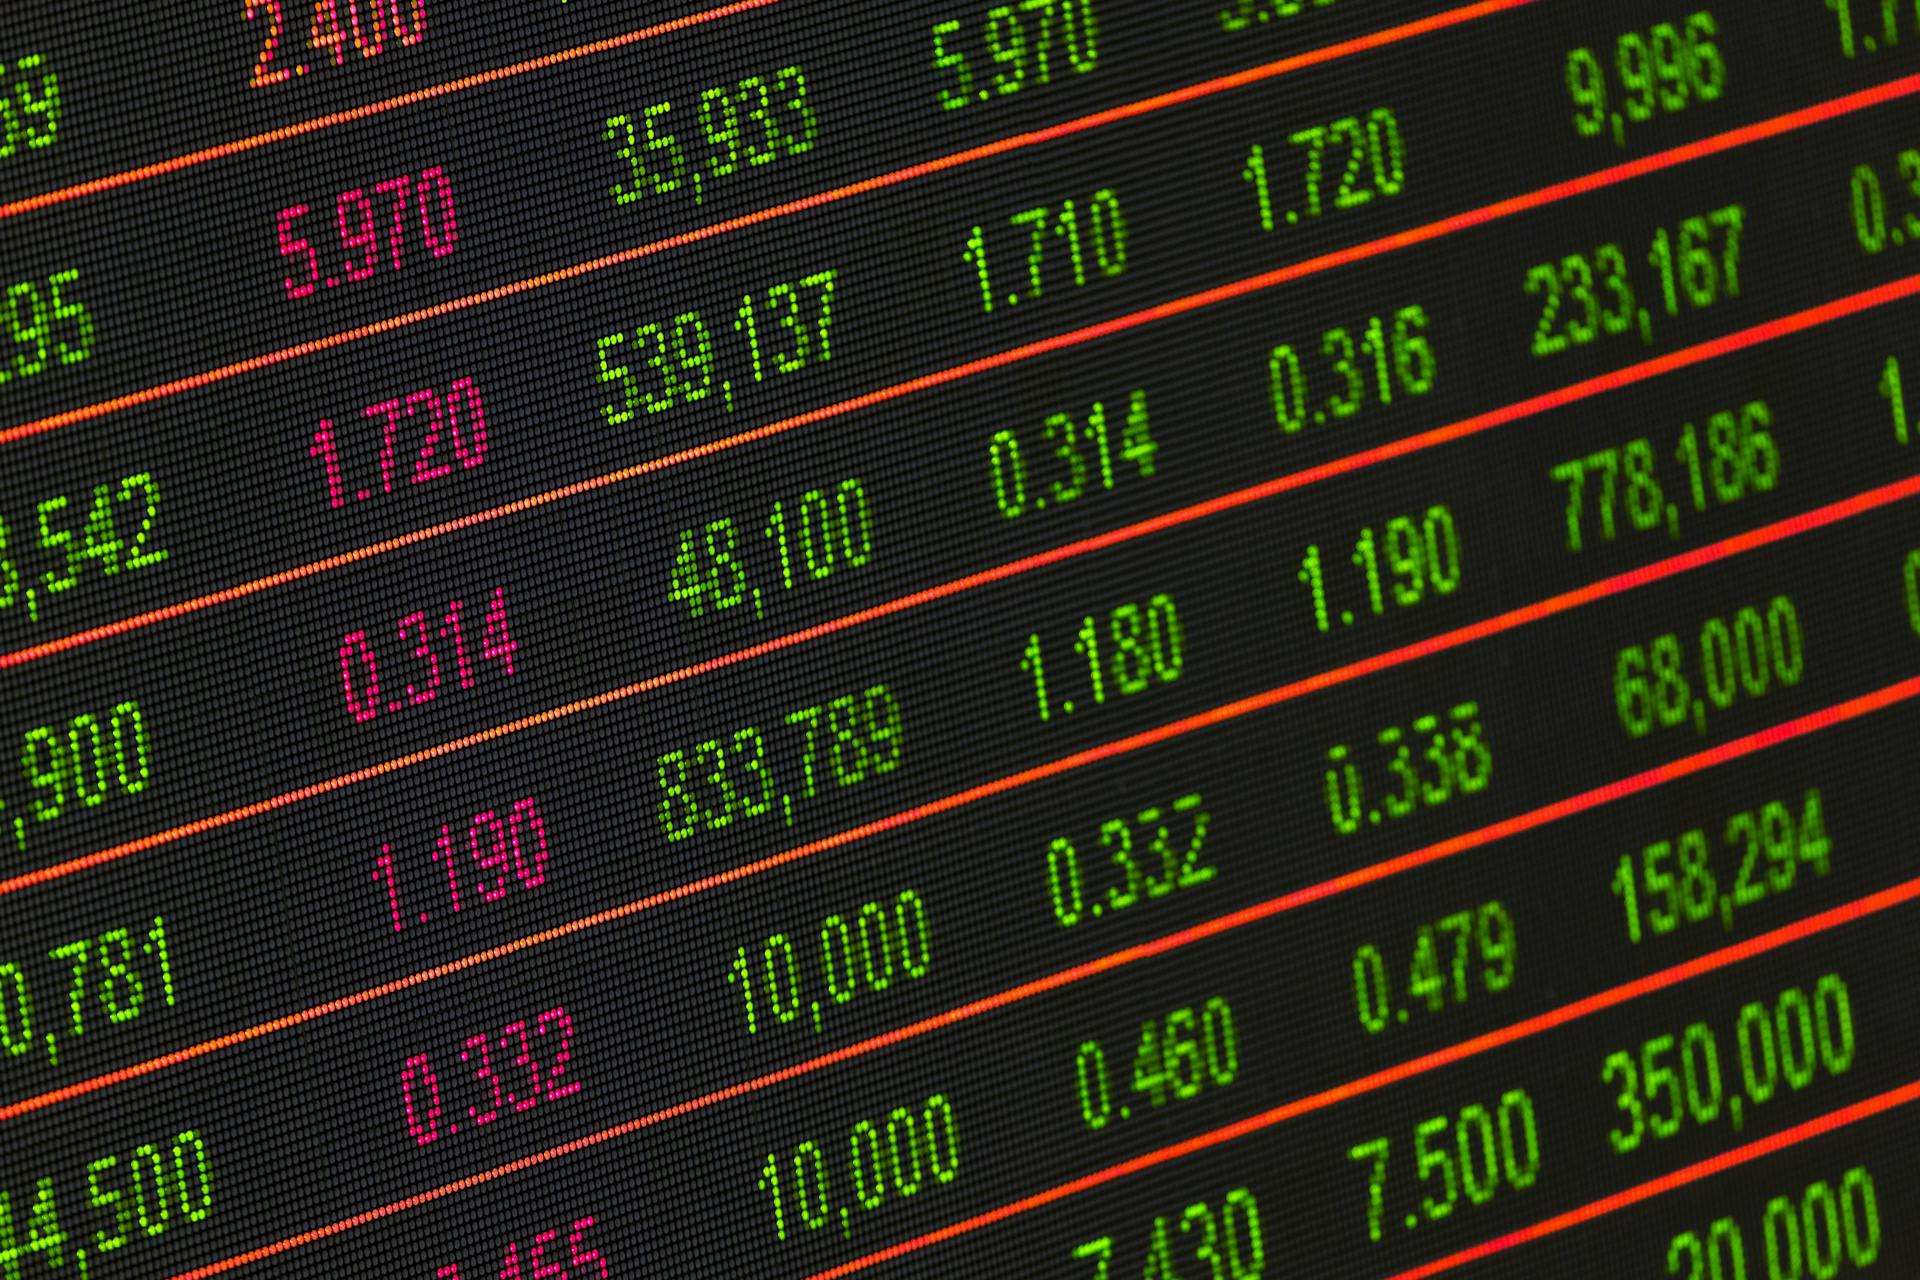
Spot rates, market trends, and trading strategies are all closely tied together.
Spot rates can fluctuate rapidly in response to changes in supply and demand, affecting market trends and trading strategies.
A key factor influencing spot rates is the availability of commodities, such as oil, which can impact global market trends.
For instance, a shortage of oil can drive up spot rates, making it more expensive for companies to import the commodity.
In this section, we'll explore how spot rates, market trends, and trading strategies intersect, and what you can do to navigate these complex relationships.
What Are Spot Rates?
Spot rates are the immediate prices set for exchanging currencies, commodities, or securities. This rate is crucial in the forex markets, where currencies are traded 24/7.
The spot rate indicates the price at which one currency can be exchanged for another at the present moment, without any delay. This immediacy is what sets spot transactions apart from futures contracts.
In the commodities market, the spot rate determines the price at which commodities like oil, gold, or wheat can be traded instantly. The spot rate is pivotal in these markets, allowing for swift exchanges to take place.
Spot rates are essential for traders and investors, as they provide the current market price for currencies and commodities. This information is vital for making informed decisions about buying and selling.
For more insights, see: Spot Price
Calculating Spot Rates
Calculating spot rates involves various factors, including current market conditions, supply and demand dynamics, and geopolitical events. This complex process is essential to ensure consistent asset pricing across markets.
Spot rates are derived from the yield curve, which represents the interest rates of bonds with different maturities. This calculation provides insight into the expected returns on investments over different time horizons.
The spot rate can be calculated using a sequence of spot rates, which ensures a bond price that prevents arbitrage opportunities. This no-arbitrage condition is critical in finance to eliminate the chance for investors to gain risk-free profit from price differentials.
If this caught your attention, see: Fx Spot Price
In the context of currency exchange, the spot rate fluctuates continuously as traders buy and sell currencies based on their expectations of future movements. This volatility can be challenging to navigate, especially for investors with limited experience.
To accurately calculate spot rates, it's essential to consider the current market conditions, including the supply and demand dynamics of the market. This information can help investors make informed decisions about their investments.
Spot rates are also used to price default-risk-free zero-coupon bonds, which are sold at a discount and repaid at face value upon maturity. This unique feature of zero-coupon bonds requires a specific calculation of spot rates to ensure accurate pricing.
Key Concepts
Spot rates reflect real-time market supply and demand for an asset available for immediate delivery.
The spot rate is a crucial factor in determining futures prices, as it's used to calculate them. Spot rates for particular currency pairs, commodities, and other securities are correlated with futures prices.
Contracts for delivery often reference the spot rate at the time of signing, making it a key consideration for traders and investors.
Types of Curves

Spot curves are a crucial tool in financial analysis, and understanding their different types is essential. The spot curve is pivotal for maturity structure analysis, especially with government bonds that standardize elements like currency, credit risk, liquidity, and tax status.
There are two main types of spot curves: upward sloping and downward sloping. An upward sloping spot curve is a typical pattern under normal market conditions, where longer-term government bonds yield higher than shorter-term bonds.
A downward sloping spot curve, on the other hand, is a rarer configuration, where shorter-term yields are higher than longer-term yields. This can signal impending economic downturns.
Here are the two types of spot curves in a concise format:
Understanding these differences can help you make more informed decisions in financial analysis.
Economic Indicators
The spot rate is intricately linked to various economic indicators that provide insights into the health of economies and influence market sentiment. Understanding these relationships can aid investors and analysts in making informed decisions.
The spot rate reflects real-time market supply and demand for an asset available for immediate delivery. This means it's highly responsive to current economic conditions.
The spot rate is affected by current market conditions, but also considers expectations about future changes in interest rates, inflation, and other economic indicators. This makes it a valuable tool for investors and businesses looking to hedge against future currency or price movements.
To better understand the relationship between spot rates and economic indicators, let's take a look at some key indicators that influence spot rates:
By understanding the relationships between spot rates and economic indicators, investors and analysts can gain valuable insights into market trends and make more informed decisions.
Market Impact
The spot rate has a significant impact on international business. It directly affects the cost of importing goods and services, as well as the revenue generated from exports.
Fluctuations in the spot rate can have a profound impact on a company's bottom line, influencing pricing strategies and financial planning. Companies need to stay on top of these changes to stay competitive.
Businesses involved in cross-border transactions often use the spot rate to manage currency risk. By locking in rates for immediate transactions, they can protect themselves against adverse movements in the forex market.
Companies that don't manage their currency risk effectively can face financial instability. This can be disastrous for small businesses or those with thin profit margins.
Trading and Hedging
The foreign exchange market relies heavily on the spot rate for currency transactions, making it a crucial factor in forex trading. This is because the spot rate determines the value of a currency at a given moment.
Forward contracts are a common financial instrument used to lock in forward rates, providing a hedge against future price fluctuations. By agreeing to a specific rate for a future transaction, parties can mitigate the risk associated with adverse movements in the spot rate. This strategy is particularly beneficial for businesses that operate internationally.
Algorithmic trading systems rely on spot rate data to execute trades based on predefined criteria and market conditions, allowing investors to capitalise on small price differentials and market inefficiencies. These systems can also help in managing risk and ensuring disciplined trading practices based on predefined parameters and risk management rules.
Intriguing read: Spot Price of Nickel
Forex Trading
The foreign exchange market is a 24-hour trading cycle with high liquidity, heavily relying on the spot rate for currency transactions. This spot rate is crucial for executing trades in the forex market.
Algorithmic trading relies on computer algorithms to execute trades based on predefined criteria and market conditions, making spot rate data essential for these systems. By leveraging algorithmic trading strategies, investors can capitalise on small price differentials and market inefficiencies.
Traders keen on arbitrage closely monitor spot rates across various platforms and exchanges to identify price disparities. Arbitrage involves exploiting price differences of the same asset in different markets to make a profit with minimal risk.
Arbitrage opportunities can manifest in different forms, such as spatial arbitrage, where price differences exist between different locations.
Hedging with Contracts
Forward contracts are a common financial instrument used to lock in forward rates, providing a hedge against future price fluctuations.
By agreeing to a specific rate for a future transaction, parties can mitigate the risk associated with adverse movements in the spot rate.
This strategy is particularly beneficial for businesses that operate internationally, allowing them to stabilise their cash flows and budget more effectively.
Forward contracts offer investors a tool for speculative purposes, enabling them to bet on the direction of future rate movements.
For your interest: Spot and Forward Rates
Technical Analysis
Technical analysis is a powerful tool for traders, allowing them to forecast future price movements based on historical data and market statistics.
The spot rate is a key component in technical analysis, providing valuable insights into market trends and potential trading opportunities.
Chart patterns, such as support and resistance levels, are commonly used in technical analysis to identify potential entry and exit points for trades.
Traders can develop trading strategies that capitalise on price movements and market trends by combining technical indicators with spot rate data.
Moving averages are one of the tools used to analyse spot rate charts and make informed trading decisions.
By spotting patterns that indicate bullish or bearish market sentiment, traders can make more informed decisions about their trades.
Technical indicators like the relative strength index (RSI) and stochastic oscillators can also help traders identify potential trading opportunities.
Traders can use spot rate charts to identify trendlines and candlestick formations, providing further insights into market trends and potential trading opportunities.
History and Trends
Spot rates have a long history dating back to the 17th century. They originated in Europe as a way to facilitate international trade.
In the past, spot rates were used primarily for short-term transactions, often lasting just a few days or weeks. This was largely due to the limitations of communication and transportation at the time.
The rise of digital technology has significantly impacted spot rates, making it easier and faster to conduct transactions across borders.
Historical Data
The concept of digital transformation has been around since the 1960s, when the first mainframe computers were introduced.
In the 1980s, the first personal computers emerged, marking the beginning of a new era in technology adoption.
The widespread use of the internet in the 1990s revolutionized the way people communicate and access information.
By the early 2000s, mobile devices had become increasingly popular, paving the way for the modern smartphone era.
The first social media platforms, such as Myspace and Friendster, appeared in the mid-2000s, changing the way people connect and interact online.
The rise of cloud computing in the late 2000s enabled businesses to store and access data remotely, increasing efficiency and productivity.
As of 2010, the global mobile phone market had reached 4.8 billion users, with smartphones accounting for over 50% of all mobile phone sales.
By 2015, the average person spent around 4 hours and 2 minutes per day on their mobile device, highlighting the significant impact of technology on daily life.
Suggestion: Tbill 1 Month
Trends and Patterns
Chart patterns are used in technical analysis to identify potential entry and exit points for trades. They include support and resistance levels, trendlines, and candlestick formations.
Traders analyse spot rate charts to spot patterns that indicate bullish or bearish market sentiment. This helps them make informed trading decisions.
By combining technical indicators with spot rate data, traders can develop trading strategies that capitalise on price movements and market trends.
Discover more: What Percent of Day Traders Make Money
Frequently Asked Questions
What is the difference between spot rate and contract rate?
Spot rates are based on current market conditions and can change frequently, while contract rates are fixed prices agreed upon for a longer period, typically six months or more
Sources
- https://analystprep.com/cfa-level-1-exam/fixed-income/spot-rates-spot-curve-and-bond-pricing/
- https://www.investopedia.com/terms/s/spot_rate.asp
- https://equalsmoney.com/financial-glossary/spot-rate
- https://www.pbgc.gov/prac/interest/vrp
- https://www.traditiondata.com/market-education/forward-rate-vs-spot-rate-whats-the-difference/
Featured Images: pexels.com


