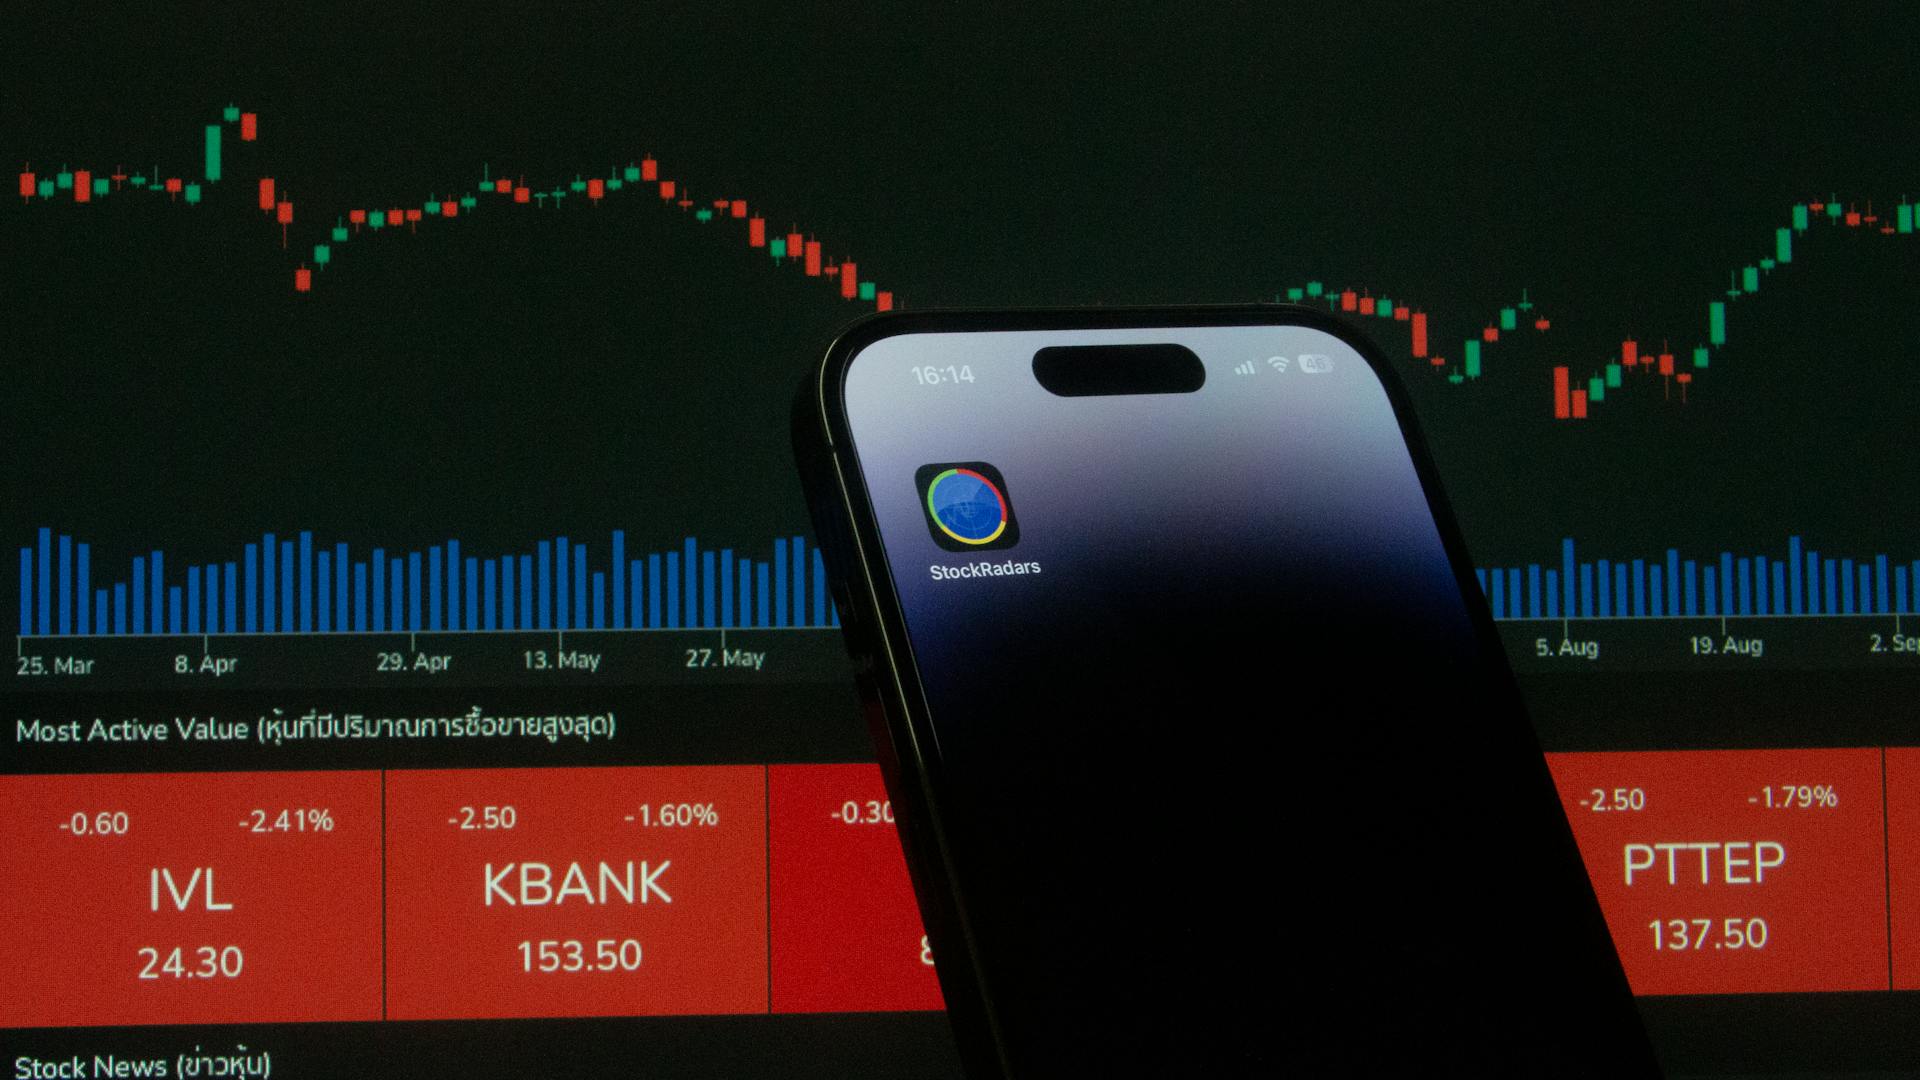
Maximum drawdown is a crucial concept in trading that can make or break a trader's confidence. It's the maximum loss from a peak to a trough in a trader's account balance.
In trading, a maximum drawdown of 20% or less is generally considered acceptable. This means that if you have a peak balance of $100, a 20% drawdown would result in a loss of $20.
A maximum drawdown can occur due to various reasons, including over-leveraging, poor risk management, or a sudden market shift.
A fresh viewpoint: Drawdown (economics)
What Is Maximum Drawdown?
Maximum drawdown is a metric that tracks the most significant potential percentage decline in the value of a portfolio over a given period. It's a way to quantify downside risk and understand the volatility of an investment.
The maximum drawdown measures the difference between the highest historical value of an investment and its lowest subsequent value, prior to recovery. This highlights the importance of timing in investment decisions, as the timing of withdrawals or additional investments can impact overall returns.
Discover more: Drawdown Equity Release

To calculate the maximum drawdown, you need to identify the peak value and trough value of a portfolio or single investment. This is typically done by looking at the historical performance of the investment.
Here's a simple breakdown of the maximum drawdown definition:
- Peak value: The highest historical value of an investment
- Trough value: The lowest value of an investment prior to recovery
- Maximum drawdown: The difference between the peak value and trough value, expressed as a percentage decline
For example, if an investor holds a stock that peaks at £100 and subsequently drops to £60 before recovering, the maximum drawdown would be calculated as a 40% decline. This metric serves as a stark reminder of the risks inherent in market investments.
Calculating Maximum Drawdown
Calculating maximum drawdown is a straightforward process that can be broken down into a few simple steps.
The first step is to identify the highest price point, or peak, of the investment over your period of evaluation. This is the highest value the investment reached before it started to decline.
To calculate the maximum drawdown, you need to track the lowest price point, or trough, that occurs after the peak but before recovery. This is the lowest value the investment reached during the period.
Worth a look: What Is Maximum Drawdown Forex

The formula for calculating maximum drawdown is MDD = (L - P) / P * 100, where L represents the lowest point or trough value and P denotes the peak value.
For example, if an investment portfolio was worth $100 million at its peak, which subsequently declined to $50 million amid a recession, the maximum drawdown would be 50%.
The calculation process involves several key components, including identifying peak values, calculating subsequent trough values, determining the percentage drop from peak to trough, and identifying the largest percentage drop as MDD.
Here's a step-by-step guide to calculating maximum drawdown:
1. Identify Peak Values: The highest points in the investment's value before a decline occurs.
2. Calculate Subsequent Trough Values: The lowest points in the investment's value after a peak and before a new peak is reached.
3. Determine the Percentage Drop From Peak to Trough: The percentage drop in value from each peak to its corresponding trough.
4. Identify the Largest Percentage Drop as MDD: The largest percentage drop among all peak-to-trough declines.
For instance, if a stock rises to £150 (peak) and then falls to £100 (trough), the maximum drawdown calculation would be ((£150 - £100) / £150) × 100 = 33.33% MDD.
Recommended read: What Is Cvar
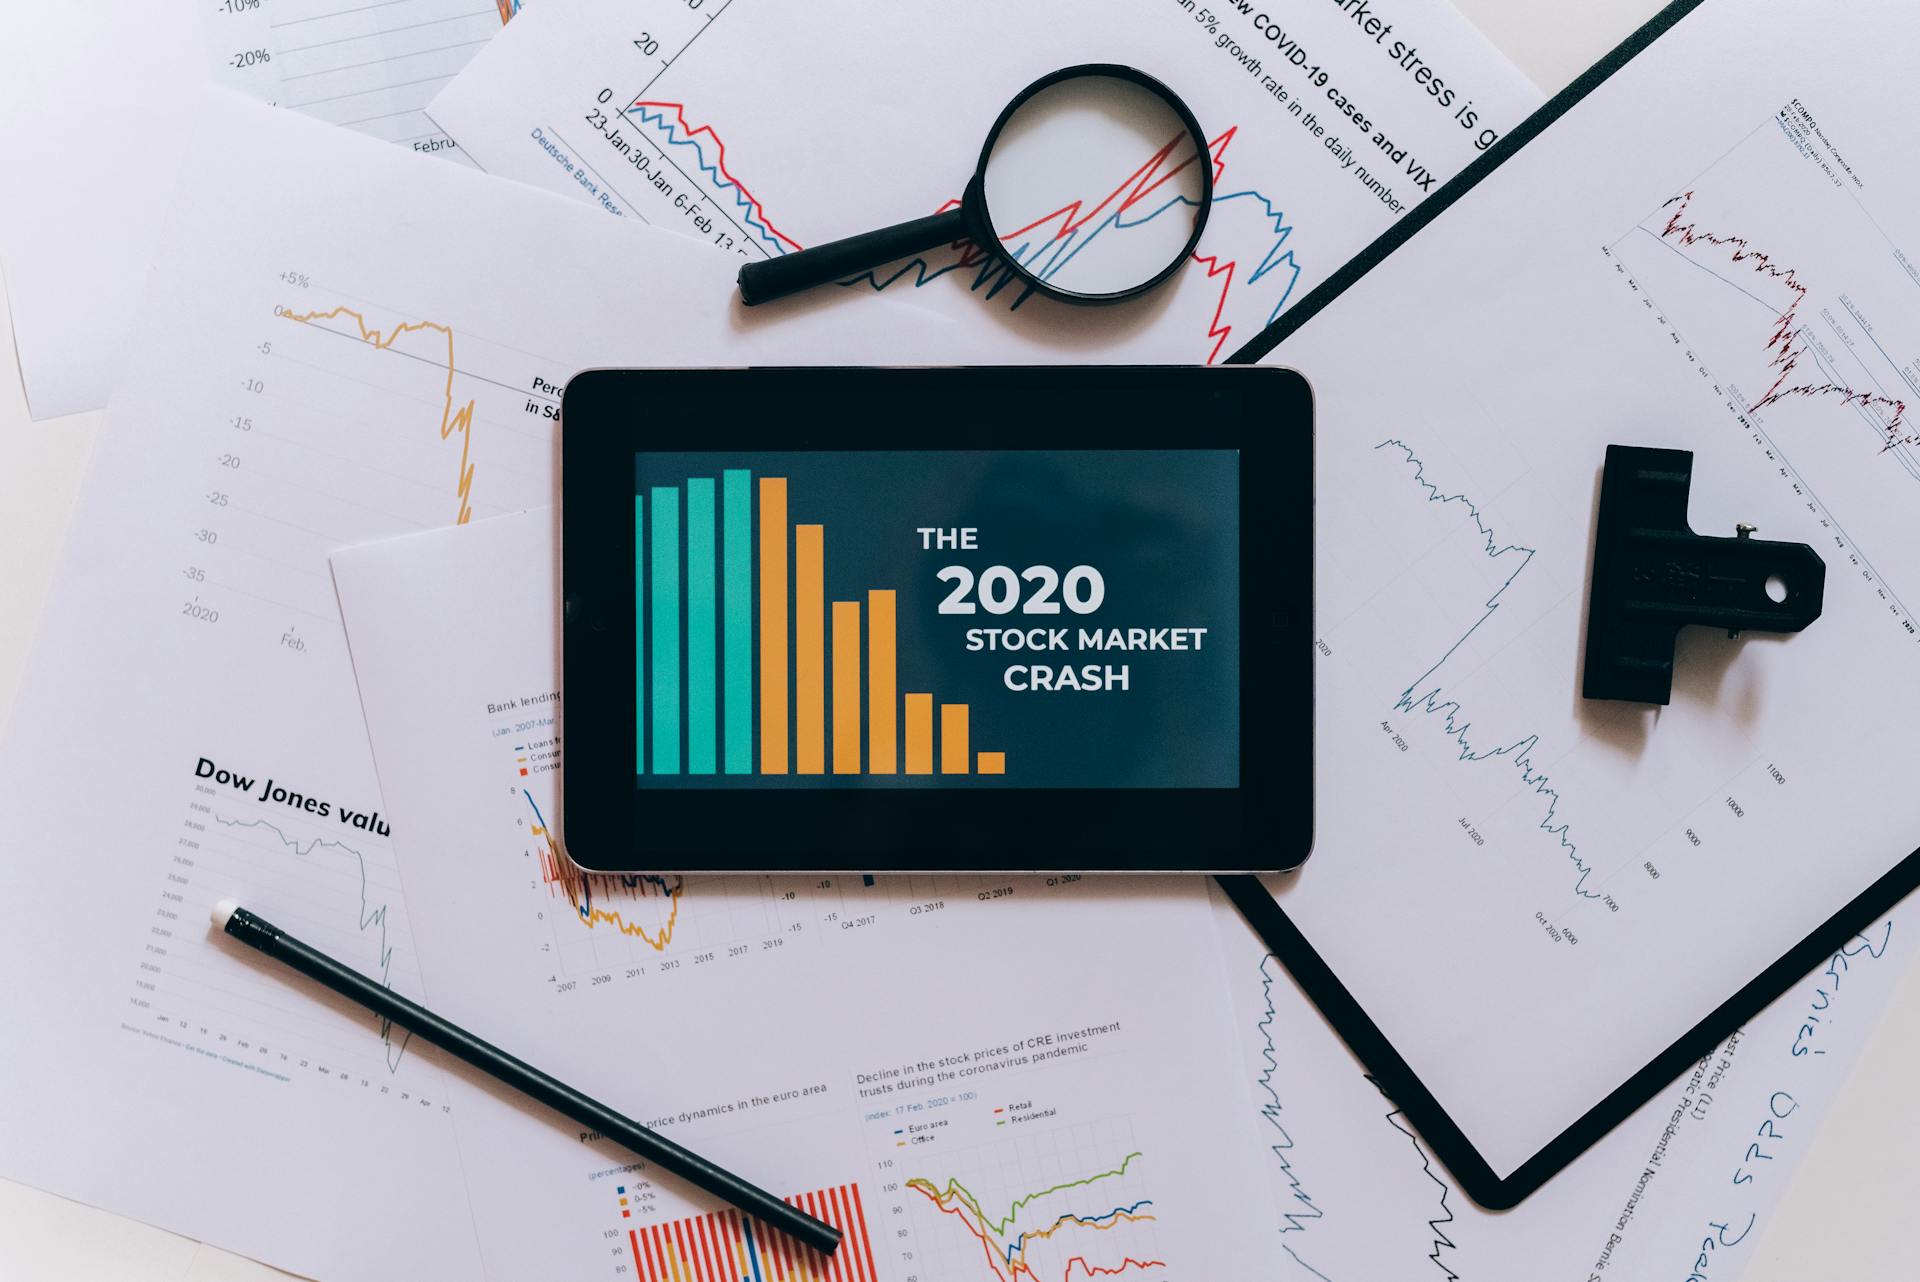
Alternatively, you can use the "MAX" function in Excel to calculate the maximum drawdown. The peak value is $200 million, which was reached at the end of 2006 (12/31/2006). The drawdown is determined by subtracting the peak value from the portfolio value in the current period, and then computing the % drawdown by dividing the drawdown amount by the peak value to date.
The maximum drawdown for the three-year period is 40%, signifying the most significant percentage decline in value from its peak to its lowest point in the given period.
Importance and Applications
Maximum drawdown is a crucial metric in finance that helps investors assess the risk profile of their investment strategies. It's a measure of the worst-case scenario of their portfolios.
Understanding maximum drawdown enables investors to make informed decisions about asset allocation, and it's not just limited to individual stocks or mutual funds. It can also be applied to entire market indices and alternative investment vehicles.
Investors with a high risk appetite may prioritize high returns and accept higher maximum drawdowns, while those with a lower risk appetite may prefer more stable investments with lower potential drawdowns.
Maximum drawdown is a practical tool for asset managers to assess the susceptibility of portfolios to adverse market conditions. It's also used by hedge funds and private equity firms to evaluate the performance of their strategies over time.
By measuring the worst historical loss starting from the highest point to lowest point, maximum drawdown gives an idea about potential downward risk. This makes it a valuable tool for indicating investment risk.
Investors with shorter investment horizons may be more sensitive to drawdown risk, as they have less time to recover from large losses. Understanding the maximum drawdown of their investments can help these investors make more informed decisions about their asset allocation and risk management strategies.
Here are some key applications of maximum drawdown:
- Retirement planning: MDD is an important consideration for individual investors, especially when planning for retirement.
- Investment horizon considerations: The investment horizon influences the importance of MDD, with investors with shorter horizons being more sensitive to drawdown risk.
- Risk management: MDD informs strategies to mitigate potential losses, such as setting stop-loss orders or shifting investment allocation to preserve capital.
Maximum drawdown is a valuable tool for measuring the risk of a portfolio, as it captures the largest historical decline in value. By understanding the maximum drawdown of various assets in a portfolio, investors can better assess their overall risk exposure and make more informed decisions about asset allocation and risk management strategies.
Understanding Drawdown Types
Maximum drawdown is a crucial concept in understanding the potential risks associated with investments. It measures the largest observed loss from a peak to a trough of an investment portfolio, expressed as a percentage.
This measure captures the most significant decline over a specified period, allowing investors to understand the extent of potential losses. The calculation involves subtracting the peak value from the lowest point, then dividing the result by the peak value and multiplying it by 100.
There are three primary types of drawdowns: maximal, relative, and absolute. Maximal drawdown gauges the biggest percentage decrease in asset worth from a top to bottom prior to attaining a fresh high point. For instance, if a portfolio increases from $100,000 to $200,000 and then falls down at $120,000 before going up once more to reach $220,000 – maximal drawdown would be calculated on the range between these extremes which is between 40%.

Here's a comparison of the three types of drawdowns:
Understanding these distinctions helps in improved handling of risk and creating practical understanding about probable investment losses.
Interpreting and Managing Drawdown
Maximum drawdown (MDD) informs strategies to mitigate potential losses, helping investment managers set more informed stop-loss orders or shifts in investment allocation to preserve capital.
Understanding MDD is crucial in risk management, as it encourages a proactive stance towards market fluctuations. By analyzing a portfolio's MDD, investors can identify potential risks and take steps to mitigate them.
Investors can use stop-loss orders to limit potential losses on individual investments. A stop-loss order automatically sells an investment when its value declines to a predetermined level, reducing the risk of further losses.
Here are some common risk management strategies:
- Stop-Loss Orders: Automatically sell an investment when its value declines to a predetermined level.
- Portfolio Insurance: Use options or futures contracts to hedge against potential losses in a portfolio.
- Dynamic Asset Allocation: Adjust the portfolio's asset mix in response to changing market conditions or the investor's risk tolerance.
Interpreting Figures
A lower maximum drawdown (MDD) indicates a better ability to manage risk during periods of market decline.
To put this into perspective, an investment manager with a lower MDD is more likely to preserve capital during market downturns.
Investors can use MDD-adjusted return metrics, such as the Calmar or Sterling ratios, to compare the risk-adjusted performance of different investment options.
These metrics consider both returns and MDD, providing a more comprehensive view of an investment's performance.
Here are some key MDD-adjusted return metrics and what they mean:
By understanding these metrics, investors can make more informed decisions about their investment choices.
Traders' Psychological Impacts
Big drawdowns can influence investor psychology in a deep way, leading to emotional responses and hasty decisions.
Fear and stress are normal reactions to significant investment value drops, causing investors to sell off assets quickly.
Loss aversion is a psychological principle that makes investors feel twice as much pain from losing money as joy from gaining it.
To deal with the adverse impact of big drawdowns, investors can use a pre-established trading plan with distinct regulations for entering, leaving, and managing risk.
Donchian channels can help investors adhere to a logical strategy by establishing clear upper and lower boundaries and providing objective signals for exiting a position.
Frequent mental accounting can keep an emotional balance by matching expectations with actual market situations.
Psychological training like being mindful or learning stress control methods can prepare investors for handling the psychological pressure of trading more effectively.
Investor education is key to lessening the psychological impact of drawdowns, as understanding that drawdowns are a normal part of investments can decrease reactions of panic.
Tools like dollar-cost averaging can provide comfort to investors when markets go down, potentially reducing average cost per share over time.
Limitations
Maximum drawdown has its limitations, and it's essential to approach it with a critical eye. MDD only provides information on the largest historical decline in value, which doesn't give insight into the frequency or duration of drawdowns.
To address this limitation, you can use complementary risk metrics, such as drawdown duration and frequency. This will give you a more comprehensive understanding of your investment's risk profile.
MDD is also insensitive to the shape of the loss distribution, which means it may not fully capture the investment's risk profile. For example, two investments with the same MDD may have different loss distributions, with one being more prone to extreme losses than the other.
Here are some key limitations of MDD as a risk metric:
- Lack of information on frequency and duration of drawdowns
- Insensitivity to the shape of the loss distribution
It's essential to consider these limitations when using MDD as a risk management tool.
Practical Implementation

To mitigate the impact of maximum drawdown on your investments, you can consider the following practical implementation strategies.
Stop-loss orders can be a useful tool to limit potential losses on individual investments. By setting a stop-loss order, you can automatically sell an investment when its value declines to a predetermined level, reducing the risk of further losses.
Diversification is another key strategy to reduce portfolio drawdown risk. By investing in a mix of assets with low or negative correlations, you can reduce the overall drawdown risk in your portfolio.
Here are some specific strategies to consider:
- Use stop-loss orders to limit potential losses on individual investments.
- Diversify your portfolio by investing in a mix of assets with low or negative correlations.
- Set drawdown thresholds for individual assets or the overall portfolio and rebalance your holdings when these thresholds are breached.
Data Requirements
To calculate the Maximum Drawdown (MDD), you'll need historical price or return data for the investment in question. This data can be obtained from various financial data sources, such as stock exchanges, financial news websites, or commercial data providers.
The time period for which the MDD is to be calculated must also be specified. This could range from a few months to several years, depending on the investor's preferences and the nature of the investment.
Discover more: Financial Risk Identification

You'll need to decide on a specific time period, such as 1 year or 5 years, to calculate the MDD. This will help you understand the potential risks and returns of the investment over a specific timeframe.
Here are some key data requirements to keep in mind:
- Historical price or return data
- Time period under consideration
Incorporating into Asset Allocation
Incorporating MDD into asset allocation decisions can be a game-changer for investors. By understanding how to mitigate the impact of MDD, you can make more informed decisions about your portfolio.
One way to reduce portfolio drawdown is through diversification. Investing in a mix of assets with low or negative correlations can reduce the overall drawdown risk in your portfolio. This is because when one asset declines, others may not follow suit, thereby reducing the overall impact on your portfolio.
Tactical allocation based on drawdown thresholds is another strategy to consider. By setting drawdown thresholds for individual assets or the overall portfolio, you can rebalance your holdings when these thresholds are breached, potentially reducing the risk of large losses.
Related reading: How Do Insurance Companies Reduce the Risk of Moral Hazard
Here are some key strategies to keep in mind:
- Diversify your portfolio to reduce drawdown risk
- Set drawdown thresholds for individual assets or the overall portfolio
- Rebalance your holdings when drawdown thresholds are breached
By incorporating MDD into your asset allocation decisions, you can make more informed choices about your investments and potentially reduce the risk of large losses.
Sources
- https://www.wallstreetprep.com/knowledge/maximum-drawdown-mdd/
- https://thetradinganalyst.com/how-to-calculate-maximum-drawdown/
- https://equalsmoney.com/financial-glossary/maximum-drawdown
- https://www.financestrategists.com/wealth-management/investments/maximum-drawdown-mdd/
- https://www.wallstreetmojo.com/maximum-drawdown/
Featured Images: pexels.com


